
Option chains are structured tables that display all available options contracts for a stock or index across different strike prices and expiry dates. By reading call and put data—such as open interest, volume, and implied volatility—you can identify market sentiment, key support/resistance levels, and make informed trading decisions.
If you’ve ever looked at option chains and felt overwhelmed by numbers, you’re not alone. At first glance, they appear complex and data-heavy. However, once you understand how to interpret them, option chains become one of the most powerful tools in trading.
In fact, professional traders rely heavily on option chain analysis to predict price movements, identify liquidity zones, and plan trades with precision. Unlike traditional charts, option chains reveal what traders are actually doing—not just what price has done.
Therefore, mastering option chains can give you a significant edge in both short-term and positional trading strategies.
SEARCH INTENT: INFORMATIONAL
This article is designed to educate traders on how option chains work, how to analyze them, and how to use them effectively in real-world trading scenarios.
What Are Option Chains?
Definition (Featured Snippet Ready)
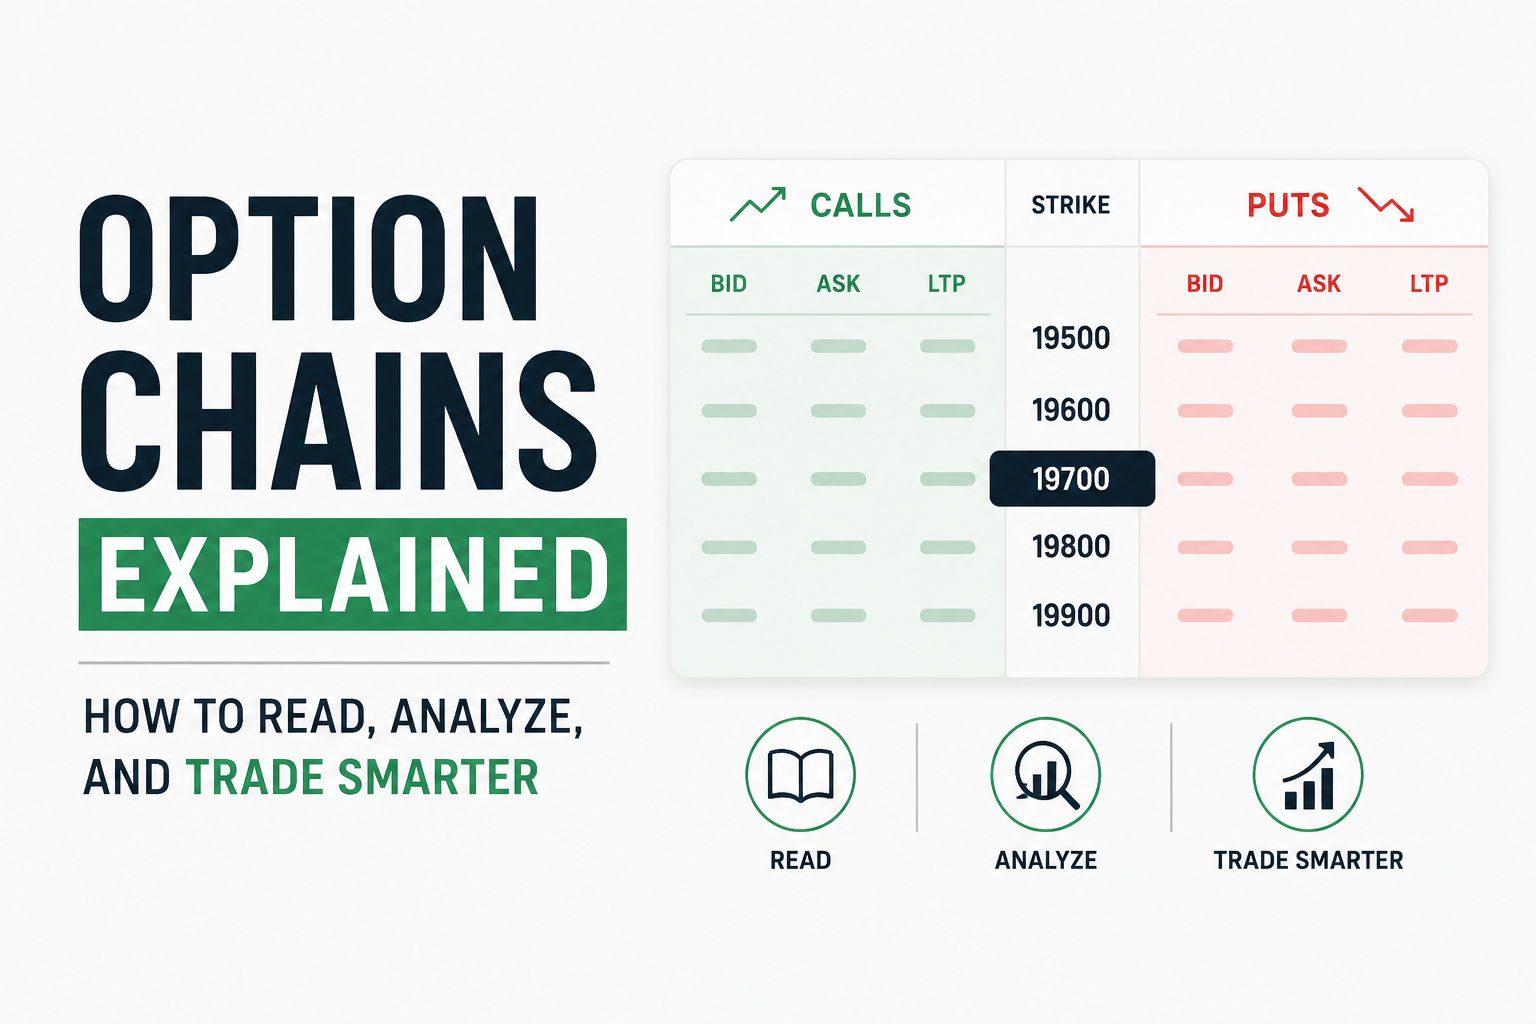
Option chains are detailed listings of all available options contracts for a specific underlying asset, organized by strike price and expiration date. They include key data such as call and put prices, open interest, trading volume, and implied volatility, helping traders assess market sentiment and potential price movements.
Understanding the Structure of Option Chains
To effectively use option chains, you must first understand their structure.
Key Components:
- Strike Price: The price at which the option can be exercised
- Call Options: Contracts that benefit from price increases
- Put Options: Contracts that benefit from price decreases
- Open Interest (OI): Number of outstanding contracts
- Volume: Number of contracts traded during the day
- Implied Volatility (IV): Expected future volatility
Layout Overview:
- Calls are typically listed on the left
- Puts are listed on the right
- Strike prices are displayed in the center
Option Chain Analysis: How to Read Option Chains Effectively
Step-by-Step Explanation (Featured Snippet Section)
Step 1: Identify the Underlying Price
Start by checking the current market price of the asset.
Step 2: Locate At-The-Money (ATM) Strike
Find the strike price closest to the current price.
Step 3: Analyze Open Interest
- High OI in calls → resistance level
- High OI in puts → support level
Step 4: Check Volume Activity
Rising volume indicates active participation and potential momentum.
Step 5: Study Implied Volatility
- High IV → expensive options
- Low IV → cheaper options
Step 6: Compare Call vs Put Data
This helps determine bullish or bearish sentiment.
Option Chains vs Price Charts: A Strategic Comparison
Comparison (Featured Snippet Section)
| Factor | Option Chains | Price Charts |
|---|---|---|
| Data Type | Real-time positions | Historical price |
| Insight | Market sentiment | Price trends |
| Key Advantage | Predictive signals | Trend confirmation |
| Complexity | High | Moderate |
| Best For | Advanced traders | All traders |
Key Insight:
While charts show what happened, option chain analysis shows what traders expect to happen.
How Traders Use Option Chains in Real Life
1. Identifying Support and Resistance
One of the most practical uses of option chains is identifying key levels.
- High Put OI → Strong support
- High Call OI → Strong resistance
Example:
If a stock has:
- 50,000 OI at 18,000 PUT
- 60,000 OI at 18,500 CALL
Then:
- Support = 18,000
- Resistance = 18,500
2. Detecting Market Sentiment
Option chain analysis helps you understand whether the market is bullish or bearish.
- More call writing → bearish sentiment
- More put writing → bullish sentiment
3. Spotting Breakout Signals
A sudden shift in OI or volume can indicate a potential breakout.
For example:
- Rapid increase in call OI at higher strikes → bullish breakout
- Rising put OI at lower strikes → bearish move
Advanced Option Chain Analysis Techniques
1. Change in Open Interest (OI Shift)
This is where real insights come in.
- Increasing OI + rising price → strong trend
- Increasing OI + falling price → strong bearish trend
2. PCR (Put Call Ratio)
PCR = Put OI / Call OI
- PCR > 1 → bullish sentiment
- PCR < 1 → bearish sentiment
3. Max Pain Theory
The price level where maximum options expire worthless.
- Markets often gravitate toward this level
- Useful for expiry-day strategies
Real-World Case Study: Nifty Option Chains
Consider a trader analyzing option chains for Nifty:
- Spot Price: 19,800
- Highest Call OI: 20,000
- Highest Put OI: 19,500
Interpretation:
- Resistance: 20,000
- Support: 19,500
Trade Setup:
- Sell calls near resistance
- Sell puts near support
Result:
The market traded within range, allowing the trader to profit from time decay.
This is a classic example of how option chain analysis translates into actionable strategy.
Common Mistakes in Using Option Chains
Even experienced traders make errors. Avoid these:
- Ignoring volume data
- Over-relying on OI alone
- Misinterpreting PCR
- Trading without risk management
Internal Linking Opportunities
- Beginner’s guide to options trading
- Advanced derivatives trading strategies
- Risk management in options trading
- Intraday trading strategies using options
External Authoritative References
- National Stock Exchange (NSE) for live option chain data
- Investopedia for options fundamentals
- SEBI guidelines for derivatives trading
FAQ Section
1. What are option chains used for?
They are used to analyze market sentiment, identify support/resistance, and plan trading strategies.
2. How do beginners read option chains?
Start with strike price, then analyze open interest and volume to understand trends.
3. What is open interest in option chains?
It represents the total number of active contracts in the market.
4. Is option chain analysis accurate?
It provides strong insights but should be combined with technical analysis.
5. What is PCR in option chains?
Put Call Ratio indicates market sentiment based on open interest.
6. Can option chains predict market direction?
They indicate probabilities, not certainties.
7. Which is better: charts or option chains?
Both are important—charts show trends, while option chains show sentiment.
CONCLUSION
Mastering option chains is no longer optional if you want to trade like a professional. They provide deep insights into market behavior, trader positioning, and potential price movements.
However, success with option chain analysis requires consistency, practice, and the ability to interpret data in context. When combined with strong risk management and strategy, option chains can significantly improve your trading accuracy.